What Does A Doji Candle Pattern Tell Crypto Traders?

There are many different trading patterns. It can be relatively easy to trade with some and more difficult to make trade decisions using others. Whether you are new to crypto trading or not, you can trade smartly with the right understanding of these trading patterns.
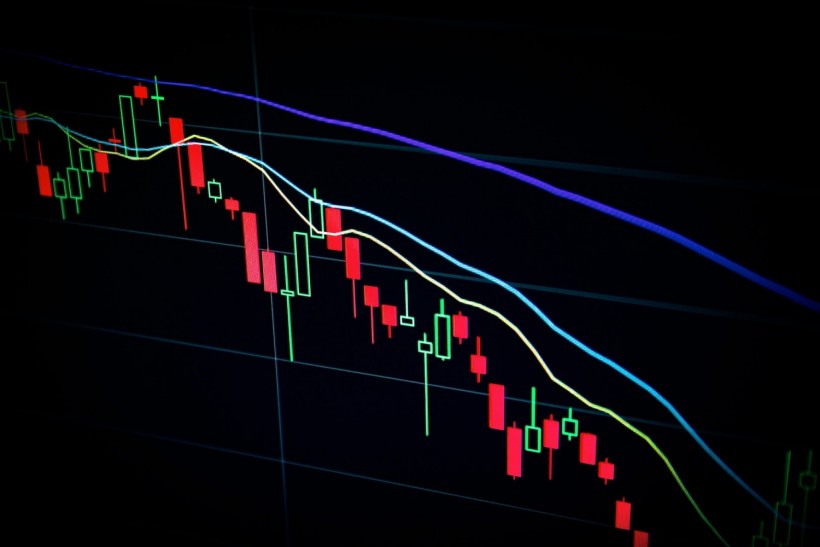
Doji candles look like a cross or plus sign without a body, so they are really easy to spot. In most cases, it means the market is about to change direction since the opening and closing prices are the same. However, sometimes people are unable to read the Doji candle rightly.
Here, let us take a quick look at how to interpret the Doji candle - what does it try to tell us about the crypto market.
Firstly, what is a Doji Candlestick?
A doji candle is an indication of how the crypto market is performing. Doji candles are interesting because their opening and closing prices are about the same, but their shadows are long above and below the candle. Both buyers and sellers are active in this market, although neither controls the market.
Whenever the market opens, prices rise due to the optimism of buyers. Then, as the market closes, sellers step in to drop the price. The top shadow of a doji candle indicates the difference between opening and closing prices.
It is generally known that the top shadow is the most expensive, whereas the bottom shadow is the cheapest. The cross-shaped candle will have an equal body and equal shadows if you have equal opening and closing prices.
What is the meaning of the Doji pattern?
Did you know that the Doji pattern derives its name from Japanese? This is a term used to describe situations where the opening and closing prices for a securities or asset do not match. When this occurs, neither buyers nor sellers are in the driving seat, which indicates that the market is uncertain about its direction.
What do traders understand from the Doji Candlestick?
Traders can learn a lot from the Doji Candle pattern. A pattern like this tells us how investors feel and what's going on in the market. These are some interpretations of the Doji candle pattern:
-
Reversal Signal
Did you ever hear of the Doji Candle pattern? This is a telling sign that the direction of the market may be changing. It is most likely that this pattern will appear after a major uptrend or downtrend, which could indicate that the trend is about to reverse. If you want to be absolutely sure that the trend is indeed changing, you should also look at other technical indicators.
-
Volatility and indecision
Whenever you see a Doji Candle pattern, it indicates that the market is in a state of confusion. Therefore, buyers and sellers are equally matched, and there is no clear indication of where the market is headed. It is like a stalemate, and making a move without more information can be hazardous. Smart traders view this pattern as a warning to proceed with caution and wait until more clarity is obtained before taking action.
-
Resistance and support levels
Pay attention to Doji Candle patterns that show up around important support or resistance levels. If you see a Doji near a support level, it might mean that the selling pressure is easing up, suggesting there's a chance for a bullish reversal. However, if you see a Doji form near a resistance level, it might mean that buying pressure is dropping, which could mean a bearish turn.
-
Psychology and market sentiment
There's something called a Doji Candle pattern when trading. This pattern shows that supply and demand are temporarily balanced. The length and shape of the pattern tell traders how people are feeling about the market. If the pattern is long and thin, there's a lot of change going on. If the pattern looks like a gravestone, there's a lot of selling pressure. Also, if the pattern looks like a dragonfly, buying pressure is high.
Final thoughts
A Doji candlestick pattern is not the best indicator for determining when to buy or sell cryptocurrencies. However, it can be useful when neither buyers nor sellers have control. It allows experienced traders to identify potential opportunities and make informed decisions. This type of trading is suitable for intermediate and advanced traders who have a strong understanding of signal interpretation.
Subscribe to Latin Post!
Sign up for our free newsletter for the Latest coverage!
* This is a contributed article and this content does not necessarily represent the views of latinpost.com


