A Beginners Guide to the ATR Indicator
The ATR Indicator was first introduced by J. Welles Wilder in his publication: New Concepts in Technical Trading Systems (1978). Its original intended use was for trading commodities. However, it has since been applied to other financial assets such as Forex, stocks, and indices.
In trading, indicators are technical analysis tools, which can be difficult for some people. This guide will hopefully make it clear and help you understand how to use ATR in trading.
The Function of the ATR Indicator
There are three main types of indicators:
● Trend indicators - a measure of trend strength and direction.
● Oscillators - a measure of change that helps determine short-term overbought/oversold conditions.
● Forecast indicators - a value used to predict future price movements based on historical regularities.
The Average True Range (ATR) indicator is often considered an oscillator. Its primary function is to measure the volatility of asset prices. With the ATR Indicator, historical data points can be used to observe the fluctuations of an asset price within a given time interval caused by gaps and limit up or down moves. When utilized correctly, the ATR Indicator can be one of the most powerful tools to add to your trading arsenal!
How to Calculate the ATR Indicator
Calculating the ATR requires you first to define a timeframe. If you are analyzing a daily price chart, then, of course, your timeframe will be defined in days. Note that you can also calculate the ATR for any increment of time.
On a daily price chart, plots called candlesticks will be shown for each day. The Candlestick represents the recorded High, Low, Open, and Close of the asset price that day. All this information is needed to calculate the ATR Indicator.
Now we define a time interval, denoted by. It is the total number of timeframes we wish to calculate the ATR over. To know what value to pick will depend on how sensitive you would like the ATR to be. The smaller the time interval, the more sensitive the ATR will be. Conversely, the larger the time interval, the less sensitive the ATR becomes. The decision on how large or small the chosen time interval is will be based upon what is most useful for your purposes. The default value of J. Welles Wilder recommended was 14 days. This means we are looking at the average true range over an interval of 14-day increments.
Now that we have defined the interval, we must begin by calculating the initial ATR, denoted. This is our starting point and is found by observing the first 14 candlesticks and calculating the True Ranges (TR) for each day.
We do so by finding the maximum value of the following:
● Hi-Li = The difference between the current High and the current Low
● |Hi-C(i-1) = The absolute difference between the current High and the previous Close
● |Li-C(i-1) | = The absolute difference between the current Low and the previous Close
These values can be read from the candlesticks in your daily chart as follows:
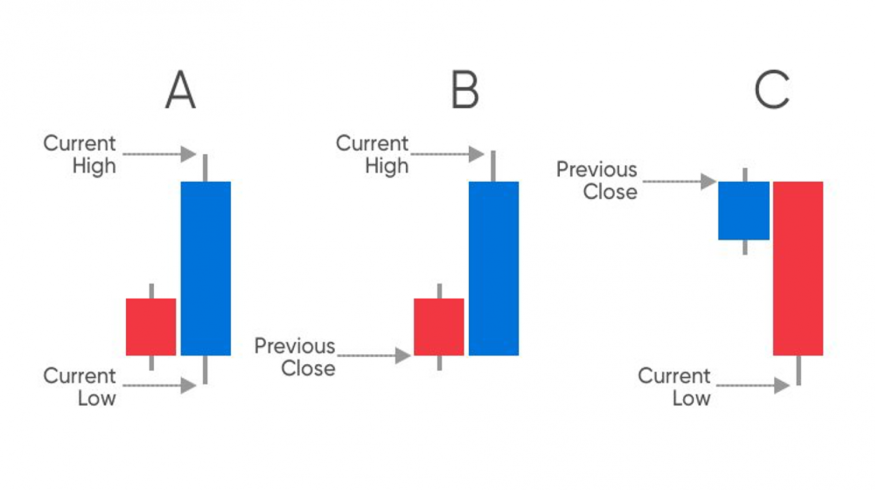
Note that the absolute value means that all values are taken to be positive. This is because we are only interested in the largest magnitude of the ranges between these values.
The full mathematical formula for the True Range per timeframe is given by:
TRi=max{(Hi-Li),|Hi-C(i-1) |,|Li-C(i-1) |},
where i is a counting index for a given timeframe. In this case, for i = 1 to 14.
After finding the True Range for the first 14 days, you are now ready to calculate the initial ATR with the formula:
ATR0=(∑(i=1)^N*TRi )/N
This formula simply means the sum of all your True Ranges for the first 14 days, divided by 14 for the average.
With this initial ATR, you may now calculate estimated current ATR values using the previous ATR value.
The smoothing formula J. Welles Wilder developed for the Average True Indicator is:
ATRi=(ATR(i-1) (N-1)+TRi)/N
Thus, the Average True Indicator (ATR) is found by dividing the sum of the current True Range and the product of the previous ATR with the time interval minus one day. It is intuitive that the larger the True Range values, the larger the ATR will be.
How to Interpret the ATR Indicator
In many financial asset charts, the ATR Indicator is featured at the bottom underneath the candlesticks. As you can see, the ATR Indicator is a continuous line graph.
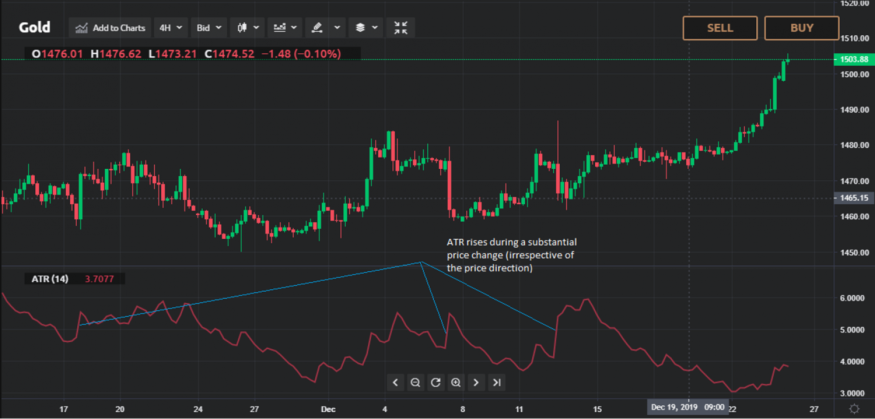
The higher the value of the ATR, the more volatile the asset is deemed to be. When the ATR is lower, the volatility of the asset is also lower.
A large ATR does not indicate whether the price of the asset will go up or down but that there are drastic changes in an unspecified direction. If the ATR is small, this would typically mean that the asset price is fairly stable within the given time interval.
As you can see from the chart, volatility can be high for an asset price trending downwards and vice versa. This means that although the price of an asset is increasing, the volatility of the price is low. Low ATR tends to coincide with time intervals where Candlesticks are short and high ATR with longer candlesticks.
How to Use the ATR Indicator in a Trading Strategy
Monitoring the moving average of volatility with this relatively simple calculation can help to deduce potential trend reversals. Thus, it can be used to assess optimal times for exiting or entering a position and aiding in the formulation of Stop-Loss order strategies.
Ideally, the best way to analyze an asset with the ATR Indicator is to compare the same asset's ATR values for previous years. By determining if volatility is at a multi-year low, it may indicate a break-out trade is on the horizon.
One popular Stop-Loss strategy that utilizes the ATR Indicator is called the Chandelier Exit. This is where a trailing stop is placed when the maximum stock has been reached since entering the trade. The difference between the maximum stock price and the stop level is equated to some multiple of the ATR.
Although the ATR Indicator has various uses by itself, the indicator produces no trading signals directly and only helps measure the strength of price movements. Because of this, it is most effectively used in conjunction with other trend and forecast indicators or alongside price action analysis methods to aid in making more informed trade decisions.
Subscribe to Latin Post!
Sign up for our free newsletter for the Latest coverage!
© 2026 Latin Post. All rights reserved. Do not reproduce without permission.


