New York Ranks #5 for Naturalization Rates in the U.S., with 59.52% of Foreign-Born Residents Becoming Citizens
3 KEY TAKEAWAYS
- New York enters the top five: New York ranks #5 nationally with 59.52% of its foreign-born residents naturalized, just below Hawaii (60.79%) and ahead of Minnesota (58.90%).
- Strong outcomes at large scale: As one of the largest immigrant-population states, New York maintains a high naturalization share, reflecting substantial citizenship uptake across a broad base.
- Just below the 60% tier: While not crossing the 60% mark, New York sits at the top of the next-highest group of states clustered just below this threshold.
Foreign-born residents are a key part of New York's population, with 59.52% naturalized, the fifth-highest rate in the U.S., just below Hawaii (60.79%). That equals 2,693,804 of 4,526,014 residents annually. This places New York well ahead of most states, where rates fall below 50%, with Arkansas lowest at 34.32%.
This report was produced by The Mendoza Law Firm, which analyzed average annual foreign-born population and naturalized citizen data across all 50 U.S. states from 2020 to 2024. For each state, the share of the foreign-born population holding naturalized U.S. citizenship was calculated and used to rank states from highest to lowest naturalization rate, identifying where foreign-born residents are most and least likely to pursue permanent citizenship.
New York at a Glance
| Metric | Value |
| U.S. State | New York |
| Foreign-Born Population (Annual Avg. 2020–2024) | 4,526,014 |
| Naturalized Citizens (Annual Avg. 2020–2024) | 2,693,804 |
| Naturalization Rate | 59.52% |
| National Naturalization Rank | 5 of 50 |
New York vs. The U.S. States Where Foreign-Born Residents Are Most Likely to Become Citizens
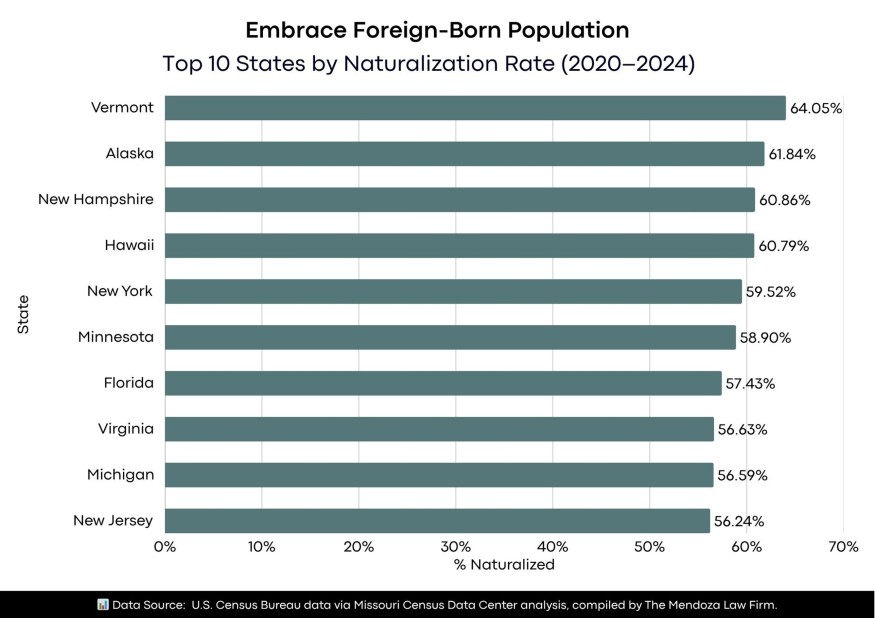
Table 1: Top 10 States by Naturalization Rate (2020–2024)
| Rank | State | Avg. Annual Foreign-Born Population | Avg. Annual Naturalized Citizens | % Naturalized |
| 1 | Vermont | 27,669 | 17,723 | 64.05% |
| 2 | Alaska | 56,745 | 35,092 | 61.84% |
| 3 | New Hampshire | 85,632 | 52,114 | 60.86% |
| 4 | Hawaii | 259,001 | 157,451 | 60.79% |
| 5 | New York | 4,526,014 | 2,693,804 | 59.52% |
| 6 | Minnesota | 497,722 | 293,146 | 58.90% |
| 7 | Florida | 4,905,727 | 2,817,269 | 57.43% |
| 8 | Virginia | 1,142,826 | 647,130 | 56.63% |
| 9 | Michigan | 728,881 | 412,498 | 56.59% |
| 10 | New Jersey | 2,236,554 | 1,257,744 | 56.24% |
New York's 59.52% places it just below the 60% tier, leading a cluster of states in the high-50% range. It sits ahead of Minnesota (58.90%) and Florida (57.43%), forming the upper half of the top 10. The gap between New York and Vermont (64.05%) highlights the spread within top-ranked states.
New York vs. The 5 Lowest Naturalization Rate States: The Citizenship Integration Gap
Table 2: Naturalization Rate Comparison: New York Against America's Least-Integrated States
| Metric | New York | Arkansas | Tennessee | Alabama | Kentucky | Louisiana |
| Naturalization Rate | 59.52% | 34.32% | 39.16% | 39.38% | 40.31% | 40.34% |
| Foreign-Born Population | 4,526,014 | 165,740 | 431,545 | 203,578 | 211,210 | 224,537 |
| Naturalized Citizens | 2,693,804 | 56,884 | 169,013 | 80,179 | 85,140 | 90,569 |
| National Rank | #5 | #50 | #49 | #48 | #47 | #46 |
A foreign-born resident in New York is about 25 percentage points more likely to be a naturalized citizen than one in Arkansas. It also exceeds each of the other bottom-five states by close to 20 points, reflecting a substantial gap.
New York vs. America's Largest Immigrant Population States
Table 3: Naturalization Rate Comparison: New York Against the Four Highest Foreign-Born Population States
| Metric | New York | California | Florida | Texas | New York |
| Naturalization Rate | 59.52% | 54.32% | 57.43% | 41.90% | 59.52% |
| Foreign-Born Population | 4,526,014 | 10,598,301 | 4,905,727 | 5,302,466 | 4,526,014 |
| Naturalized Citizens | 2,693,804 | 5,756,924 | 2,817,269 | 2,221,483 | 2,693,804 |
| Non-Naturalized Foreign-Born | 1,832,210 | 4,841,377 | 2,088,458 | 3,080,983 | 1,832,210 |
| National Rank | #5 | #15 | #7 | #41 | #5 |
New York's 59.52% naturalization rate is higher than California (54.32%), Florida (57.43%), and Texas (41.90%), but below Vermont and Alaska. It stands about 18 points above Texas, reflecting strong outcomes at scale.
Methodology
The study analyzed average annual foreign-born population and naturalized citizen data across all 50 U.S. states from 2020 to 2024. For each state, the share of the foreign-born population holding naturalized U.S. citizenship was calculated and used to rank states from highest to lowest naturalization rate, identifying where foreign-born residents are most and least likely to pursue permanent citizenship.
Data Sources
- Naturalized U.S. Citizen Data: https://mcdc.missouri.edu
- Research Dataset: https://docs.google.com/spreadsheets/d/1jXTaXFxuDu8RoXeX2fezGNgZPv6jd56J2KozoDX4DcU/edit?gid=0#gid=0
- Study by: https://mendozafirm.com/
About The Mendoza Law Firm
The Mendoza Law Firm is an immigration law practice helping individuals and families navigate the U.S. immigration system. With a focus on community advocacy and accessible legal support, the firm serves underserved populations while raising awareness about public safety issues affecting communities across the country.
Subscribe to Latin Post!
Sign up for our free newsletter for the Latest coverage!
© 2026 Latin Post. All rights reserved. Do not reproduce without permission.


