New York State Economy Added 20,600 Private Sector Jobs in January 2022
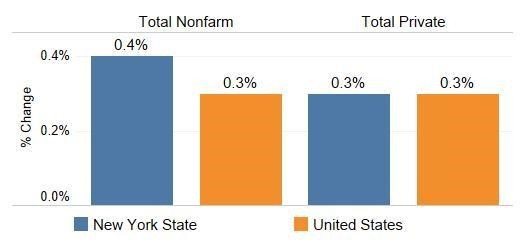
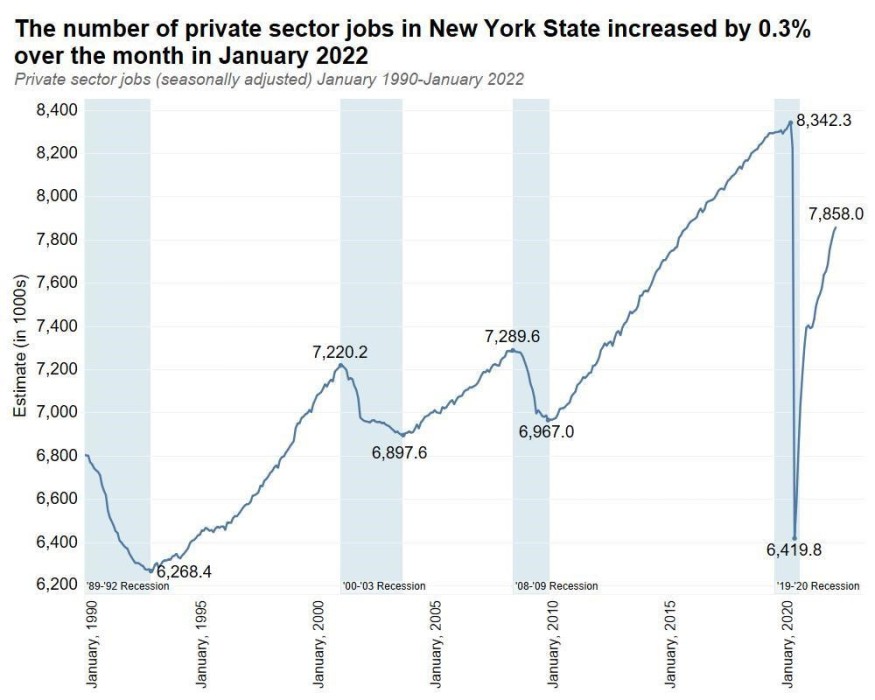
According to preliminary seasonally adjusted figures released today by the New York State Department of Labor, the number of private sector jobs in New York State increased over the month by 20,600, or 0.3%, to 7,858,000 in January 2022. By comparison, the number of private sector jobs in the U.S. increased by 0.3% in January 2022.
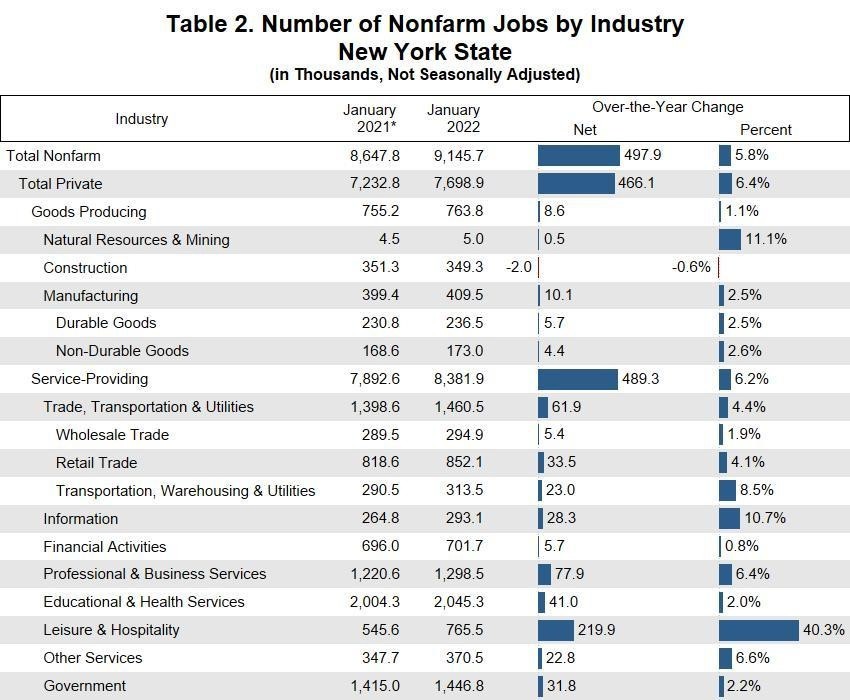
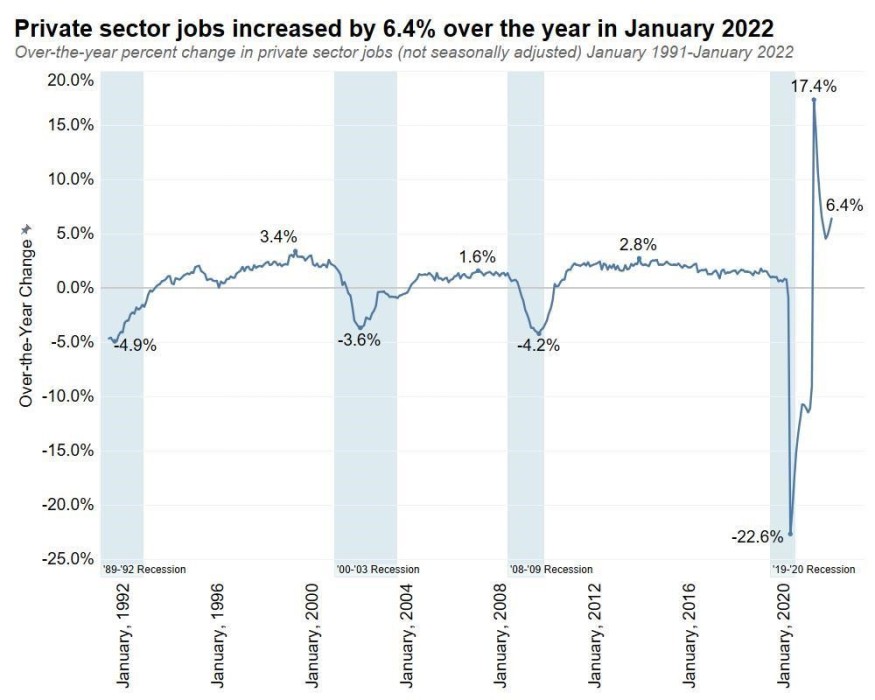
New York State's private sector jobs (not seasonally adjusted) increased by 466,100, or 6.4%, over the year in January 2022. By comparison, the number of private sector jobs in the U.S. increased by 5.2% over the year.
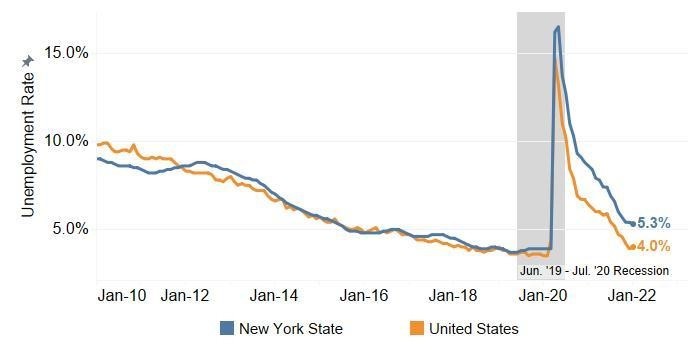
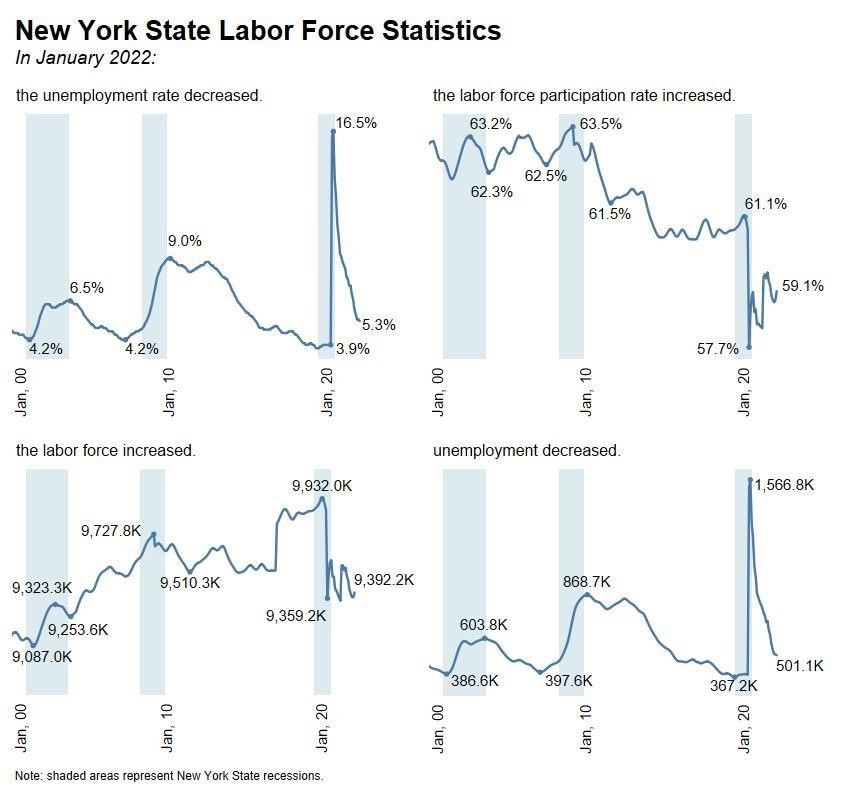
New York State's seasonally adjusted unemployment rate decreased from 5.4% to 5.3% in January 2022.
The number of private sector jobs in New York State is based on a payroll survey of 18,000 New York businesses conducted by the U.S. Department of Labor's Bureau of Labor Statistics (BLS). Monthly payroll employment estimates are preliminary and subject to revision as more complete data become available the following month. The BLS calculates New York State's unemployment rate based partly upon the results of the monthly Current Population Survey (CPS) of approximately 3,100 households in the State.
Jobs data are revised at the end of each year for all states and the nation as more complete information becomes available from employers' Unemployment Insurance records. This process is called "benchmarking" and is federally mandated. For a comparison of 2020 - 2021 annual data after benchmarking, see Summary of Annual Results beginning on page 14.
Labor force data, including unemployment rates, are also revised at the end of each year, using methods established by the U.S. Bureau of Labor Statistics. The revised labor force data show that New York State's annual average unemployment rate decreased from 9.9% in 2020 to 6.9% in 2021.
Note: Seasonally adjusted data are used to provide the most valid month-to-month comparison. Non-seasonally adjusted data are valuable in year-to-year comparisons of the same month - for example, January 2021 versus January 2022.
Statewide Industry Employment
January 2022 - Seasonally Adjusted
- On a net basis, the total number of nonfarm jobs in the state increased by 36,000 over the month, while private sector jobs rose by 20,600, in January 2022.
- At the same time, the total number of nonfarm jobs in the nation increased by 467,000, while private sector jobs increased by 444,000.
NYS Nonfarm Job Growth Exceeded the Nation's
Over-the-Month % Change in Total Nonfarm & Private Sector Jobs, December - January 2022
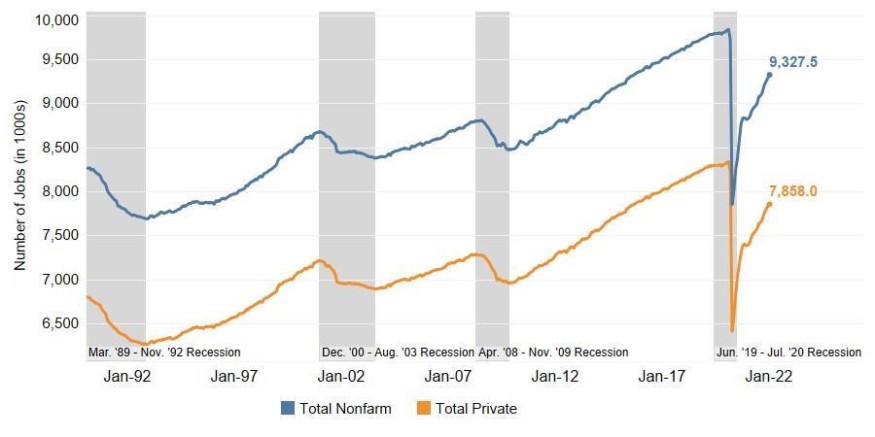
Total Nonfarm and Private Sector Jobs Increased in January 2022
Total Nonfarm and Private Sector Jobs (in 1000s), January 1990 - January 2022
Statewide Unemployment
January 2022 - Seasonally Adjusted
- In January 2022, the statewide unemployment rate decreased from 5.4% to 5.3%
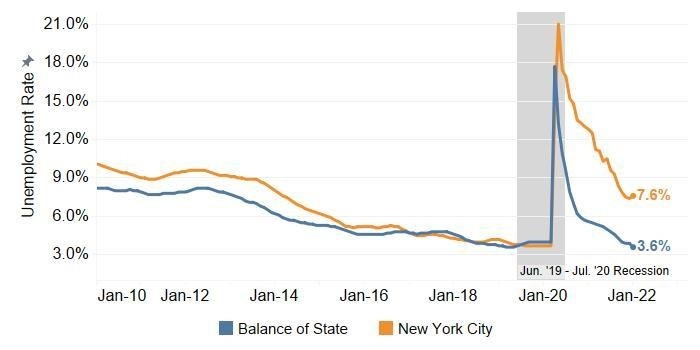
- New York City's unemployment rate increased over the month from 7.4% to 7.6%. Outside of New York City, the unemployment rate decreased from 3.9% to 3.6%.
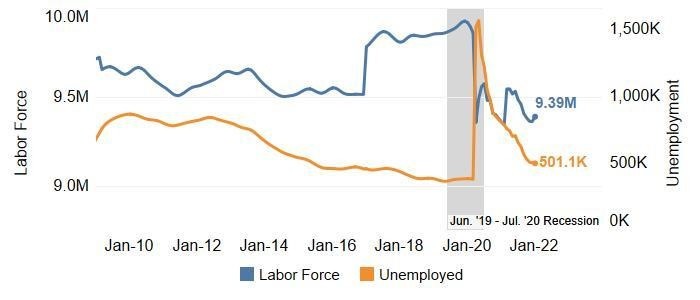
- The number of unemployed New Yorkers decreased over the month by 4,300, from 505,400 in December to 501,100 in January 2022.
NYS Unemployment Rate Fell by 0.1 Percentage Point in January 2022
Labor Force Statistics, January 2021, December - January 2022

The Labor Force Increased While the Number of Unemployed Fell in January 2022
Total Labor Force & Number of Unemployed, January 2010 - January 2022
NYS Unemployment Rate Decreased, US Rate Increased
Unemployment Rate, NYS & US, January 2010 - January 2022
Unemployment Rate Increased in NYC, Fell in Balance of State
Unemployment Rate, NYC & BOS, January 2010 - January 2022
Substate and Industry Employment
January 2022 - Not Seasonally Adjusted
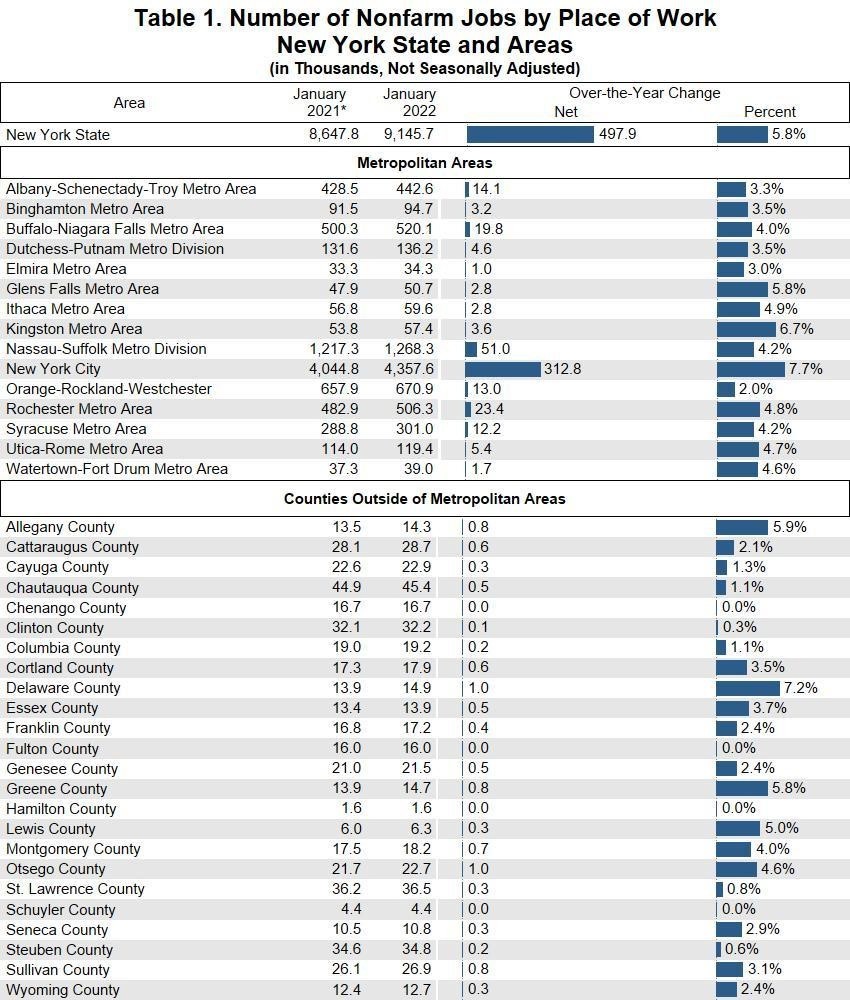
New York State Exceeded Nation in Private Sector Job Growth
Over-the-Year Change in Total Nonfarm & Private Sector Jobs, January 2021 - January 2022
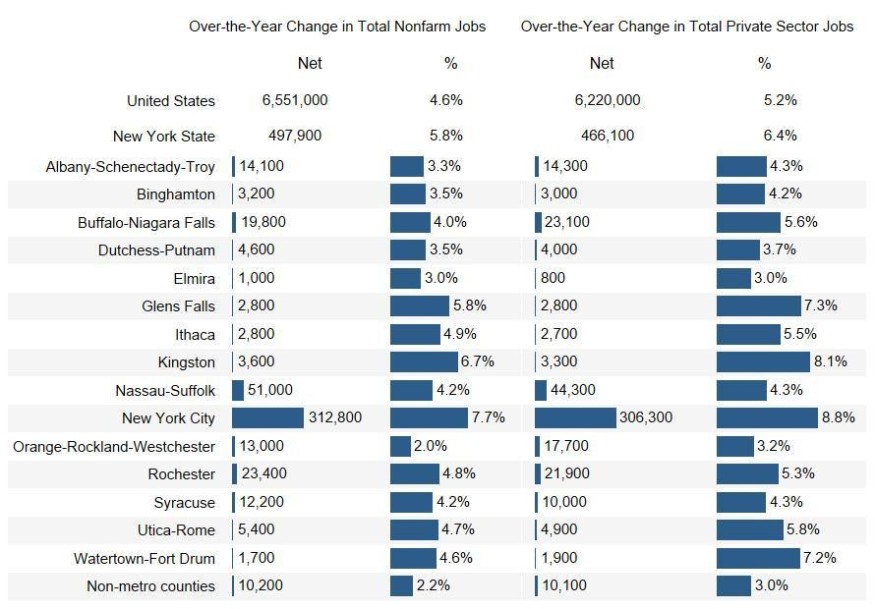
Note: The sum of sub-state area job estimates will usually differ from the New York State total. This is because the State total is calculated separately from the sub-state areas and is estimated based on an independent sample.
The Number of Leisure & Hospitality Jobs Increased by 40.3% Over the Year
Over-the-Year Change in Jobs by Major Industry Sector, January 2021 - January 2022
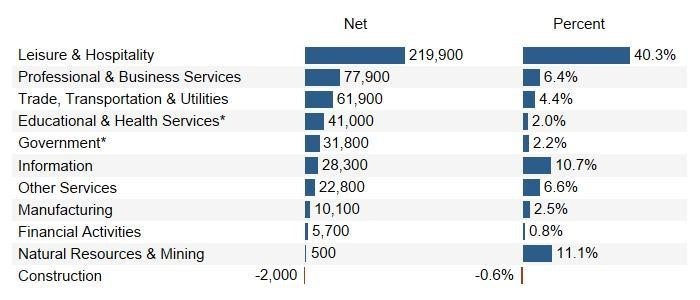
*Educational and health services is in the private sector. Government includes public education and public health services.
Note: The responsibility for the production of monthly estimates of state and metro area nonfarm employment by industry moved from the NYS Department of Labor's Division of Research and Statistics to the U.S. Bureau of Labor Statistics (BLS), starting with the March 2011 estimates. More detailed information on the change is available on the BLS web site.
Many economic data series have a seasonal pattern, which means they tend to occur at the same time each year (e.g., retail jobs usually increase in December). Seasonal adjustment is the process of removing seasonal effects from a data series. This is done to simplify the data so that they may be more easily interpreted and help to reveal true underlying trends. Seasonal adjustment permits comparisons of data from one month to data from any other month.
In New York State, payroll jobs data by industry come from a monthly survey of 18,000 business establishments conducted by the U.S. Bureau of Labor Statistics. Data are preliminary and subject to revision. Jobs data by industry do not include agricultural workers, the self-employed, unpaid family workers or domestic workers in private households.
Labor force statistics, including the unemployment rate, for New York and every other state are based on statistical regression models specified by the U. S. Bureau of Labor Statistics. The state's unemployment rate is based partly upon the results of the Current Population Survey, which contacts approximately 3,100 households in New York each month.

Jobs and Unemployment Fact Sheet
This fact sheet conveys important technical information that will contribute to a better understanding of labor force data ("household survey"), including resident employment/unemployment rates, and jobs by industry data ("business survey"), which are presented in the New York State Department of Labor's monthly press release.
State Unemployment Rates Based on Regression Model
Beginning with data for January 1996, unemployment rates for New York State and all other states (as well as New York City and the City of Los Angeles) have been estimated using time-series regression statistical models developed by the U.S. Bureau of Labor Statistics (BLS).
Advantage of Regression Model
Use of a time-series regression model reduces the month-to-month variation in unemployment rates and resident employment by reducing variation caused by sampling errors and other components of statistical noise (irregularities).
Benchmarking of Estimates
Once each year, labor force estimates, such as civilian labor force and the unemployment rate, are revised to reflect updated input data including new Census Bureau populations controls, newly revised establishment jobs data and new state-level annual average data from the Current Population Survey (CPS). As part of this procedure, all state figures are reviewed, revised as necessary and then re-estimated. This process is commonly referred to as "benchmarking."
Changes in Methodology
Labor force estimates are now produced with an improved time-series regression model, which utilizes "real-time" benchmarking. "Real-time" benchmarking reduces end-of-year revisions, which also means that major economic events will be reflected in a more timely manner in state labor force estimates.
In addition, the new methodology includes an updated way of estimating for sub-state areas (e.g. counties, metro areas) the number of unemployed who are new entrants or re-entrants into the labor force. This change in methodology will result in lower unemployment rates in some areas and increased rates in others.
Unemployed and UI Beneficiaries
The estimate of the number of unemployed includes all persons who had no employment during the reference week (the week including the 12th of the month), were available for work, except for temporary illness, and had made specific efforts to find employment sometime during the 4-week period ending with the reference week. Unemployment insurance (UI) beneficiaries include those who apply for and qualify for UI benefits. Consequently, the estimate of the number of unemployed and the number of UI beneficiaries do not necessarily move in tandem.
Jobs Data
Jobs data are obtained from a separate joint federal-state survey of business establishments. The survey, called the Current Employment Statistics of Establishments, has a sample size of 18,000 establishments in New York State. It excludes self-employed workers, agricultural workers, unpaid family workers and domestic workers employed by private households. This data represents a count of jobs by place of work. Data for each month is revised the following month as more complete information becomes available.
Comparison of Annual Data After Benchmarking
Nassau-Suffolk and Watertown-Fort Drum saw the fastest job growth in 2021
% Change in Annual Average Jobs, U.S., New York State & Metro Areas, 2019-2020 & 2020-2021
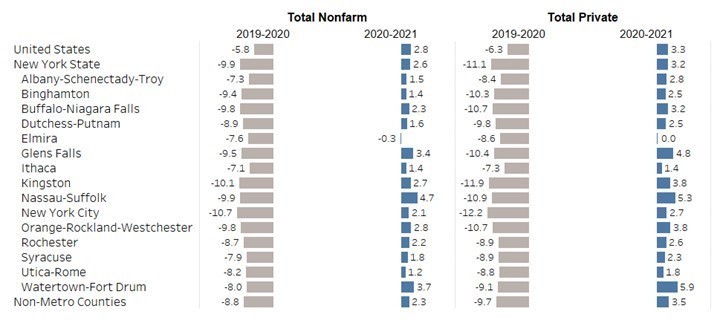
Non New York State metro areas or non-metro counties lost private sector jobs in 2021
% Change in Annual Average Private Sector Jobs, New York State Metro Areas & Non-Metro Counties, 2020-2021

Job highlights for New York State metro areas:
- In 2021, private sector jobs increased most rapidly in these New York State metro areas:
- Watertown-Fort Drum (+5.9%)
- Nassau-Suffolk (+5.3%)
- Glens Falls (+4.8%)
- Kingston (+3.8%)
- Orange-Rockland-Westchester (+3.8%)
- In addition, private sector employment grew by 3.5% in New York State's non-metro counties in 2021.
More than one-third of the State's private sector job gains were in the leisure and hospitality industry
Change in Annual Average Jobs by Industry, New York State, 2020-2021
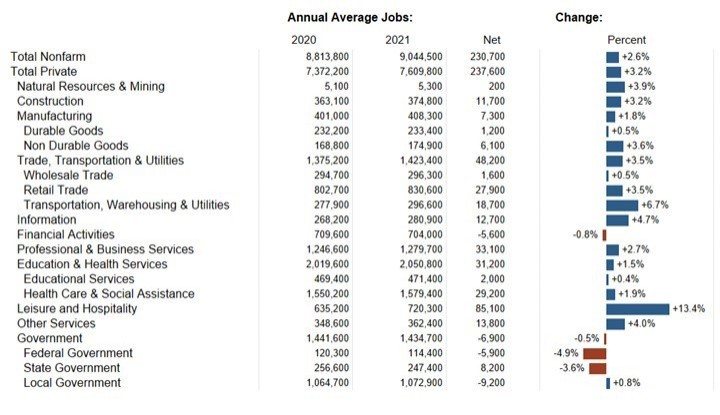
Job highlights for statewide industries:
- The state's annual average private sector employment increased by 237,600, or 3.2%, to 7,609,800 in 2021.
- Leisure and hospitality added the most jobs (+85,100) of any industry sector in the state in 2021. Sector job gains were mostly in accommodation and food services (+71,500), especially food services and drinking places (+69,300).
- Trade, transportation and utilities added 48,200 jobs between 2020 and 2021. Sector gains were primarily concentrated in retail trade (+27,900) and transportation, warehousing and utilities (+18,700).
- The third largest increase in jobs in 2020-21 occurred in professional and businesses services (+33,100). Sector employment gains were focused in administrative and support services (+21,800), especially employment services (+16,700).
The New York State Department of Labor is an Equal Opportunity Employer/Program.
Auxiliary aids and services are available upon request to individuals with disabilities.
READ MORE: NYS Economy Added 45,400 Private Sector Jobs in December 2021
Subscribe to Latin Post!
Sign up for our free newsletter for the Latest coverage!
© 2026 Latin Post. All rights reserved. Do not reproduce without permission.


